Tableau for Beginners
Tableau for Beginners training is designed to equip participants with the skills and knowledge needed to use Tableau desktop, a Business Intelligence and data visualization application. This training focuses on teaching various techniques and tools used to extract meaningful insights from data, which can be applied to make informed business decisions.

Overview
Tableau for Beginners training is a structured training program designed to introduce individuals with little to no prior experience to Tableau, a powerful data visualization and analytics tool. This training aims to equip participants with the foundational skills needed to create, customize, and design visualizations from various datasets. The key components of the training are:
- Understanding the purpose and capabilities of Tableau in the context of data visualization and analytics.
- Connect to diverse data sources
- Understand the usage of filters and parameters
- Creating data visualizations and dashboards
The training provides a strong foundation in Tableau desktop, data analysis techniques, tools, and practical applications, empowering participants to leverage data to get business insights.
Demand for Tableau professionals
The demand for Tableau is substantial and continues to grow because of increasing adoption of data analytics. As organizations across various industries recognize the importance of data-driven decision-making, there’s a growing demand for individuals who can effectively analyze and visualize data. Professionals performing the roles such as business analysts, data analysts, and even executives, often lack formal training in data visualization tools like Tableau. Beginner-level training helps bridge this skill gap by providing foundational knowledge and practical skills.
Course Details
RESOURCES
Download:
Download Tableau public desktop from:
https://www.tableau.com/products/public/download
Book:

Related Courses


Related Blogs
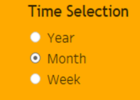
How to display a Tableau dashboard for Different Time Periods

Stacked Bar Chart with two measures and Totals

Fixing User Specific View Thumbnail in Tableau
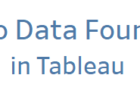
How to display No Data Found in Tableau
Which Country celebrates New Years the First